FinTech or Financial Technology refers to the utilization of software and modern technology to provide financial services by the use of smartphones for mobile banking, investing services and cryptocurrency which are all examples of Fin-tech practices. We conducted thorough analysis on social media in fin tech within the MENA region in 2018. We have analyzed 26 fin-tech companies’ social accounts and queries that crawled all posts and activities related to fin-tech in the middle east throughout the year 2017. All data in this article is generated through the Crowd Analyzer tool.
{{cta(‘0c05ae36-db6b-4834-847d-baed7edfe65e’,’justifycenter’)}}
Social Media In FinTech Activities:
2017 for Social Media in Fin-tech:
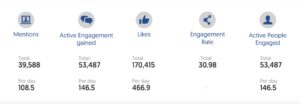
Overall, the Fin-tech social media activity in the MENA region is still very low compared to other industries. Yet, one cannot neglect the drastic improvement 2017 brings compared to 2016. In a nutshell, the number of interactions tripled from 2.5K to 8k in 2017.
Despite Fin-tech penetration being low in the MENA region, Fin-tech social accounts received more than 8K interactions in 2017, which is triple the number of interactions received in 2016. In addition to the rate of interactivity of users which indicates the increase in users’ interest in the industry, the number of unique users who tweeted and posted about Fin-tech has also undergone a huge change from 1.06K in 2016 to 34.9K in only one year. This huge jump of 35x means that more people were posting original content on Fin-tech. The increase in number of interactions and unique users, doesn’t necessarily convey the number of people who use Fin-tech services, yet it shows that 2017 is a milestone in raising awareness about Fin-tech services in the MENA region.
Which Countries Contributed Most To The Fin-tech Buzz:
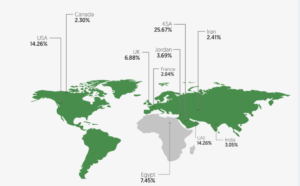
As the social media in Fin-tech has been through a huge growth in terms of activities within the MENA region, Saudi Arabia has undergone the highest growth rate in the region.
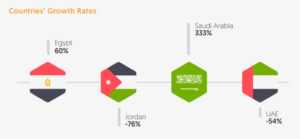
If we take a look at the Fintech online content, we will realize that Saudi Arabia had undergone a drastic growth from 6% to 25.67%, which is a 333% increase. UAE and Jordan had negative growth rates compared to 2016, Egypt had a modest growth of 60%.
Males, Females, & Businesses… Which Contributed More? and Where?
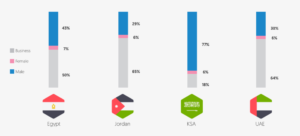
On social media in fin-tech across all the MENA region, females were the least active in in the social media activities related to the Fin-tech industry. On the contrary, Business accounts were more involved in all countries in the Middle East except Saudi Arabia, where Fin-tech activity was dominated by Male users.
Which Language Was Used In The Fin-tech Industry?
Users in every country seem to be comfortable using a specific language even if it’s not their mother tongue. Although by experience, social media analysts tend to know which languages are preferred in each country. However, many industries seem to be very specific in the language used in its content. Here’s the percentage of Arabic Vs. English in each country.
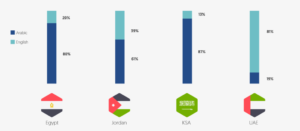
The majority of users across the region used Arabic to publish their content and tweet about Fin-tech services. Meanwhile, 81% of activities in UAE were published in English.
Are Users Satisfied?
One of the main perks of analyzing user-generated content on social media is collecting insights about users’ feedback. Since many users tend to post neutral content on social media platform, analysts and researchers eliminate the this content in order to know the sentiment a brand, topic, or an industry most receives.
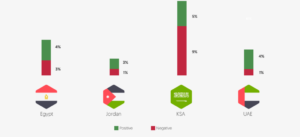
Users from Saudi Arabia published the highest number of sentimental posts, which composed 14% of Saudi Arabia’s activities about Fin-tech. On the other hand, Jordan was the lowest in sentiment, where no more than 5% of Jordan’s content about Fin-tech was sentimental at all.
As shown in the graph above, Saudi users weren’t very satisfied with the industry, unlike their counterparts in other countries, where the positive sentiment was dominating user-generated content. Positive dominated over all the countries except for Saudi Arabia where the negative sentiment was higher.
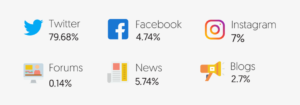
Which platforms were used in the industry
Almost 80% of activities were present on Twitter. Instagram came as the second most engaging platform with 7%. Thanks to public pages, Facebook was the 4th network and the 3rd most used social media platform in the buzz. When it comes to websites, news websites take the lead posting news articles about Fin tech with a percentage even higher than Facebook’s public pages. Public forums were the least utilized by online users and businesses to talk about Fin-tech.
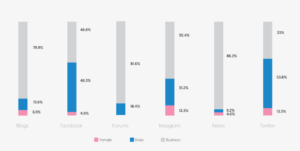
Which platforms were preferred by Personal accounts & Business accounts?
Overall, 2017 wasn’t much different from 2016 regarding gender participation. In 2016, most of the posts were created by business accounts and fin-tech companies rather than individuals. In 2017, male users had the highest percentage when it came to posts related to Fin-tech (46%). While there has been growth in overall fin-tech activity, male users’ participation was 5 times more than female users.
Business Accounts
Business accounts dominated all activities in all channels except for Facebook and Twitter where activities were dominated by male users.
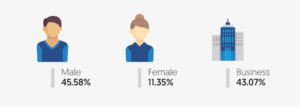
Male Users VS. Female Users
Female users seem to be uninterested in Fin-tech, as their contribution to the activities of the industry did not exceed 11.5%. Male individuals , on the contrary, dominated all the activities by ranking higher on Twitter and Facebook, to own more than 45% of the activities.
Did Sentiment Change From One Platform to Another?
Most of user-generated content on social media was neutral. Facebook and Twitter were the most sentimental. Users across the region resorted to Facebook and Twitter to display their satisfaction through posting and tweeting positive reviews and opinions. Twitter had the highest positive activities with 54% of all if its content on the platform.
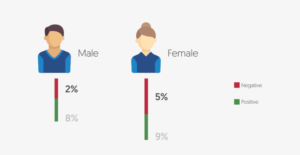
How Did The Sentiment Change Across Different Genders?
As mentioned earlier, we measure sentimental activities by eliminating neutral content. While positive is the dominating sentiment in all genders.
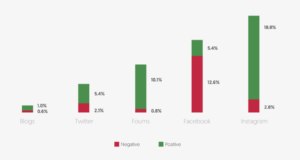
Was Sentiment Expressed Differently on Various Channels?
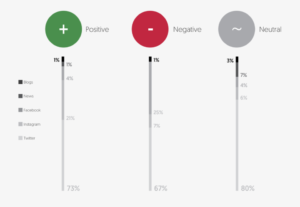
Twitter is the most sentimental channel. Moreover, Twitter users’ activities were more positive than negative towards Fin-tech topics on Twitter. On the other hand, news channels were the least sentimental.
Social Media in Fin-tech is only one of 8 industries that were covered by in the State of Social Media 2018. Download your free copy to access more data and insights.